Earnings at risk: What climate change means for equity returns
Share
Some investors are taking on more risk than they realise by assuming it’s ‘business as usual’ for high-impact carbon emitters. In a new normal where emitting carbon incurs higher financial penalties, investors need to consider carbon pricing risk – the gap between the current carbon price and the price they might have to pay in the future in a 1.5-2°C world.
More than ever, investors believe in the importance of responsible investing. In the climate arena, there’s a growing agreement that humanity must change its course to protect the environment.
And yet, when we discuss this topic with investors, we find there are often some misgivings.
Yes, we’re told, ESG and climate are important – but it’s hard to understand exactly how important, and harder still to integrate these concerns into a portfolio.
These misgivings often reveal a sense of dichotomy. On one hand, mounting evidence compels us all to make a climate impact with our portfolios; on the other, our fiduciary duty instructs us to act in the best financial interests of the principal. For many investors, those objectives remain hard to reconcile.
Recently, we have been looking for a way to bridge the gap between financial risk and climate risk, and to help investors connect the dots between the climate imperative and the pursuit of the optimal risk-adjusted return.
Carbon pricing risk is a very interesting way of doing just that. In our view, integrating carbon pricing risk analysis will give investors a bigger picture view of financial risk and how to optimise a particular portfolio in relation to it.
Carbon pricing risk: an increasingly necessary metric
Let’s examine what we have just called ‘carbon pricing risk’. To be more specific, we’re referring to what might happen to a portfolio when we account for the carbon price in our risk analysis.
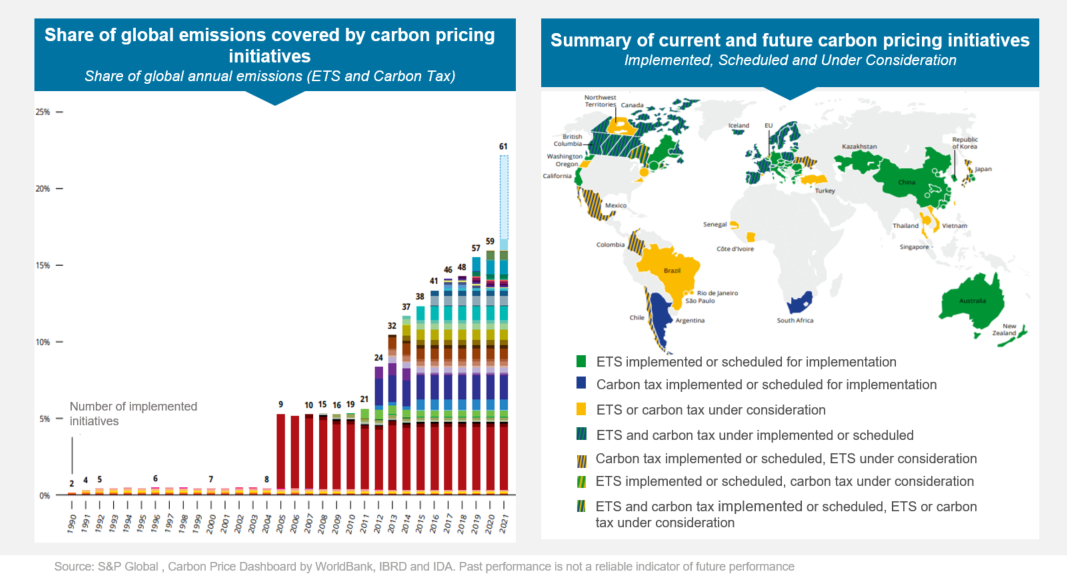
Carbon pricing is a network of global initiatives designed to curb carbon emissions. In the chart below, you can see (left hand side) that 23% of carbon global emissions are now ‘covered’ by carbon pricing initiatives such as carbon taxes and emissions trading systems. The red bar shows EU allowances, and the big blue bar on the rightmost column is China.
This chart shows carbon pricing schemes are growing globally. The right hand chart shows how these schemes are spread around the world.
Carbon pricing is proliferating, and even though it is still a nascent initiative and remains complex and fragmented, it will improve over time. What we want to highlight now is the important link between the carbon price and unpriced risks which might be embedded in a portfolio
Unpriced carbon cost
When viewing the issue through a data scientist’s lens, a key metric to look at is unpriced carbon cost. This is the difference between what a company pays now in terms of carbon price and what it will pay in future. For this we use data from Trucost, part of S&P Global.
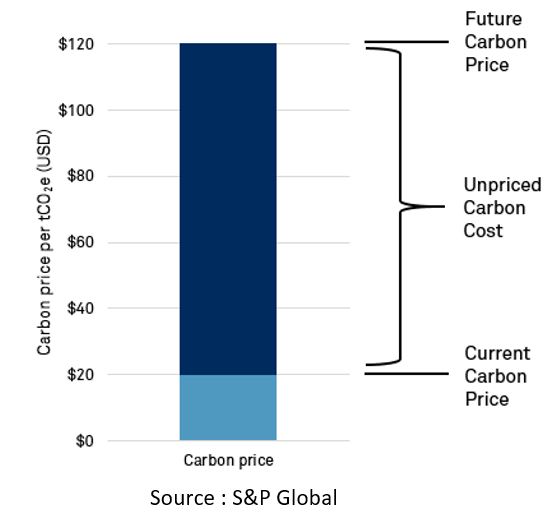
Trucost defines three carbon price scenarios in its methodology. In each of these forecasts, carbon prices rise dramatically over the coming years – meaning a growing gap between current and future price, and thus a greater unpriced carbon cost. Given carbon pricing schemes are one of the main tools in the policymaker’s kit, we are confident in saying the carbon price will only continue to increase over time.
Projecting carbon price impact on earnings
We selected Trucost’s medium (“delayed action”) carbon price scenario for our analysis. Despite it being the middle path, we feel this could actually be a conservative assumption of where the carbon price could go.
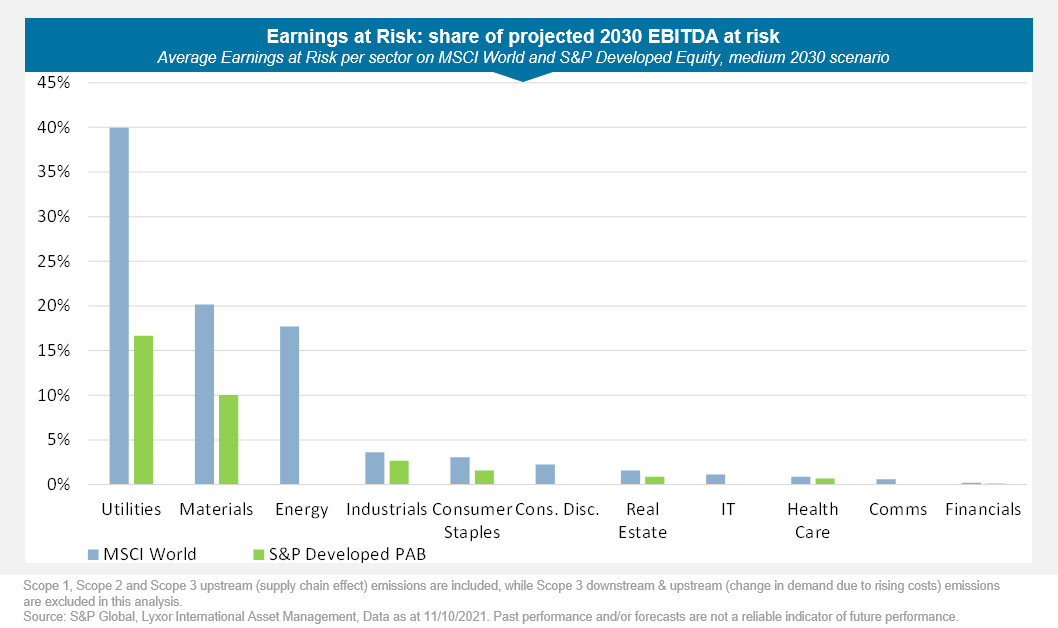
To look at how unpriced carbon price risk could affect companies’ profitability, we started with the MSCI World index. Using earnings statements, we tried to represent the carbon price risk – again, that’s the difference between what the company pays today and what it might pay tomorrow – and what that would represent as a share of their EBITDA. This gave us a measure of “earnings at risk”, or more accurately, EBITDA at risk. (EBITDA refers to earnings before interest, taxes, depreciation and amortisation and is a common metric for evaluating a company’s operating performance.)
Our analysis highlights a significant risk to future earnings from the unpriced expected future carbon price, especially in sectors such as energy, materials and utilities. In the utilities sector for example, the projected carbon price increases might wipe out 50% of the sector’s average EBITDA by 2040.
It’s important to note that 2040 is far in the future, and that these results depend heavily on modelling and on what changes are made to companies’ emissions and business models by then. So, we can’t safely say that this will happen. However, based on all the data we have access to, we can start to see carbon prices might pose a significant risk for these companies’ earnings, on the basis of their current emissions and financial health.
Climate Transition & Paris-Aligned solutions
In this article, we are ultimately performing a simple stress-test. How would a sector, or a portfolio, react to carbon price changes and how would this feed through to earnings and market value?
To continue the investigation, we looked at the alternative exposures to certain mainstream indices, using Paris-Aligned and Climate Transition benchmarks, or ‘PAB’ and ‘CTB’ respectively. These benchmarks, and the ETFs tracking them, aim to reduce the carbon emissions of a given exposure immediately – by 50% for PAB and 30% for CTB – and put a portfolio on a trajectory of reducing carbon emissions over time, typically by 7% per year.
So, we conducted the same exercises as before – same benchmark, same universe, same portfolio. As the carbon emissions are cut by 50%, we can very simply divide the earnings at risk by a factor of two (see Earnings at Risk chart below).
One step further: loss of enterprise value
To go one step further in terms of portfolio impact, we also analysed Enterprise Value/EBITDA, using a basic model which shows expected loss of enterprise value on the basis of a 10x EV to EBITDA multiplier.
By 2030, again using the medium scenario, we estimate a loss of 16% of the average enterprise value of MSCI World.
We conducted the same exercise for enterprise value at risk, meaning the projected reduction in enterprise value in a portfolio (see Enterprise Value at Risk chart below). This starts from Europe in light blue, to Climate Transition in turquoise blue, to Paris-Aligned in green. We can see here a quite mechanical reduction in risk when investing in CTB or PAB benchmarks. It’s also interesting to note that this reduction is quite consistent across regions.
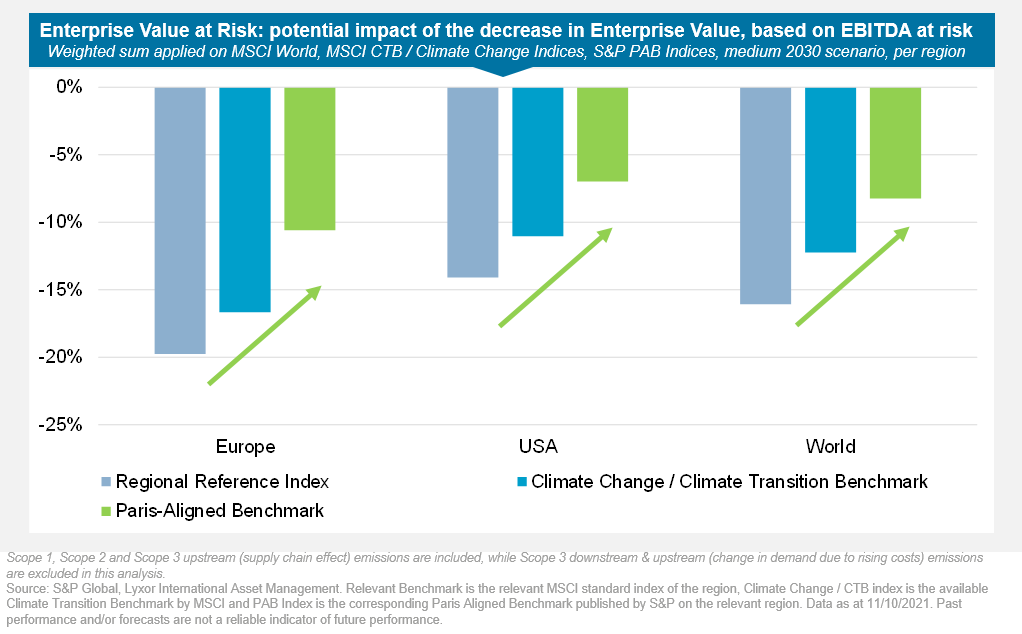
So, if you’re looking at a Europe, US or World portfolio, and want to reduce carbon emissions, that reduction comes with a commensurate reduction in financial risk. From an investment perspective, therefore, this might actually make your choice more fiduciary.
Our conclusion is the following: since carbon pricing is here to stay, and the price is very likely to increase in future, it poses a huge and underappreciated risk for companies, especially in the energy, materials, and utilities sectors. Climate indices such as the Paris-Aligned Benchmark (PAB) significantly reduce carbon emissions, and in doing so, could significantly reduce the carbon pricing risk embedded in holdings like this in your portfolios today.
Through our analysis, we can make a solid link between carbon emissions to the financial performance of a portfolio.
To learn more about our climate ETFs, including detailed performance and risk breakdowns, please get in touch with your usual Amundi contact or explore our Climate hub.